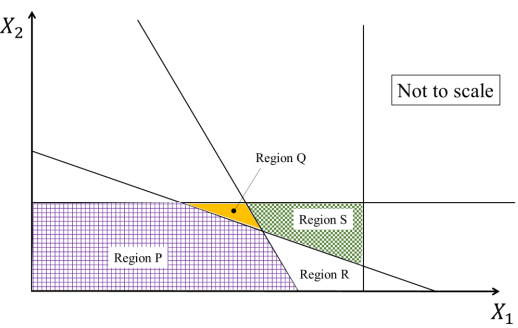
Which one of the options given represents the feasible region of the linear programming model:
Maximize 45X1, + 60X2
X1 ≤ 45
X2 ≤ 50
10X1 + 10X2 ≥ 600
25X1, + 5X2, ≤ 750
Correct Answer :
Region Q
Solution :
The correct option is Region Q.
To determine which region represents the feasible region of the given linear programming problem, we analyze the constraints step-by-step:
Constraint 1:
This boundary is a vertical line at
.
The inequality
restricts the feasible region to the left side of this vertical line.
Constraint 2:
This boundary is a horizontal line at
.
The inequality
restricts the feasible region to be below this horizontal line.
Constraint 3:
Dividing both sides by 10 gives:
The boundary line is
with intercepts at
and
.
Testing the origin
:
is False, which means the feasible region lies on the side opposite to the origin (above and to the right of the line).
Constraint 4:
Dividing both sides by 5 simplifies this to:
The boundary line is
with intercepts at
and
.
Testing the origin
:
is True, meaning the feasible region lies on the origin side of this boundary line (below and to the left).
Identifying the Feasible Region:
By combining these constraints, the feasible region is bounded by:
1. Below the horizontal line
2. Above/right of the line
3. Below/left of the line
Let's find the intersection points forming this bounded region:
• Intersection of
and
:
This gives the vertex
.
• Intersection of
and
:
This gives the vertex
.
• Intersection of
and
:
Subtracting the first equation from the second:
Then:
This gives the vertex
.
This forms a triangular region enclosed by the vertices , , and . Comparing this to the provided graph in the image, this exact region is labeled as Region Q.
Access expert-curated educational resources and study materials—completely free.
Create, conduct, and manage professional online assessments with Crey. Perfect for teachers and institutes.
Copyright © 2026 Crey. All Rights Reserved.