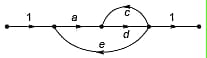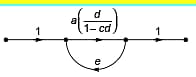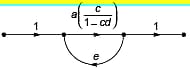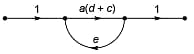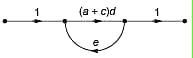
Which of the options is an equivalent representation of the signal flow graph shown here?
Correct Answer :
Solution :
The correct answer is Option 1.
To determine which of the options is an equivalent representation of the signal flow graph shown in the question, we can calculate and compare their overall transfer functions using Mason's Gain Formula.
Step 1: Analyzing the Original Signal Flow Graph
From the original image (Image 0), we can identify the following components:
- The nodes represent the variables: input node , intermediate nodes , , and output node .
- There is a forward path with branches labeled with gains and , giving a forward path gain:
- There are two feedback loops in the original graph:
1. A loop with gain:
2. A loop with gain:
- Since the forward path touches both loops, the cofactor is .
- The determinant of the graph is:
- Using Mason's Gain Formula, the overall transfer function is:
Step 2: Evaluating Option 1
Looking at the representation in Option 1 (Image 1):
- The forward path gain contains a branch with gain:
cascaded with another branch of gain , giving:
- The loop gain is formed by feedback path and the forward branch, giving:
- The overall transfer function of this modified graph is:
Since is mathematically identical to , Option 1 is the equivalent representation of the original signal flow graph.
Access expert-curated educational resources and study materials—completely free.
Create, conduct, and manage professional online assessments with Crey. Perfect for teachers and institutes.
Copyright © 2026 Crey. All Rights Reserved.