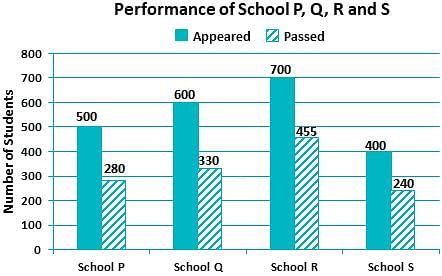
The bar graph shows the data of the students who appeared and passed in an examination for four school P, Q, R and S. The average of success rates (in percentage) of these four schools is _____.
Correct Answer :
Solution :
The correct option is 59.0%.
Step-by-Step Explanation:
By analyzing the bar graph titled "Performance of School P, Q, R and S", we can extract the number of students who appeared (represented by the solid bars) and those who passed (represented by the patterned/striped bars) for each of the four schools:
1. School P:
Number of students appeared = 500
Number of students passed = 280
The success rate of School P is calculated as:
2. School Q:
Number of students appeared = 600
Number of students passed = 330
The success rate of School Q is calculated as:
3. School R:
Number of students appeared = 700
Number of students passed = 455
The success rate of School R is calculated as:
4. School S:
Number of students appeared = 400
Number of students passed = 240
The success rate of School S is calculated as:
Now, to find the average of the success rates of these four schools:
Therefore, the average success rate of these four schools is 59.0%.
Access expert-curated educational resources and study materials—completely free.
Create, conduct, and manage professional online assessments with Crey. Perfect for teachers and institutes.
Copyright © 2026 Crey. All Rights Reserved.