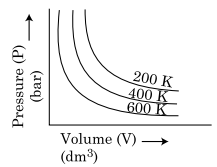
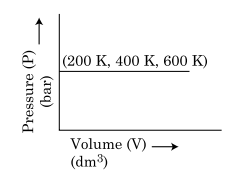
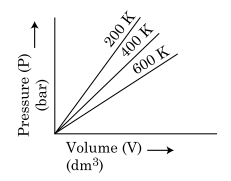
Choose the correct option for graphical representation of Boyle’s law, which shows a graph of pressure vs. volume of a gas at different temperatures :
Correct Answer :
Option 4
Solution :
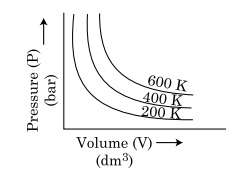
The correct option is Option 4 (represented by the fourth graph, showing the isotherms at different temperatures with the outermost curve at 600 K, the middle curve at 400 K, and the innermost curve at 200 K).
Explanation:
According to Boyle's Law, for a fixed mass of gas at a constant temperature, the pressure () of the gas is inversely proportional to its volume (). This relationship can be expressed mathematically as:
or
where is a constant for a given mass of gas at a constant temperature.
A plot of pressure () versus volume () at a constant temperature yields a rectangular hyperbola. Each curve on this graph corresponds to a specific temperature and is known as an isotherm.
To determine the relative positions of the isotherms at different temperatures, we can refer to the ideal gas equation:
Rearranging the equation to solve for pressure gives:
From this equation, we can see that for any fixed volume (), the pressure () is directly proportional to the absolute temperature (). Therefore, at any given volume, a higher temperature will correspond to a higher pressure. This means that as the temperature increases, the isothermal curve shifts outward, moving further away from the origin and the coordinate axes.
Comparing the temperatures given in the problem:
Hence, the outermost curve (with the highest pressure values) must represent the highest temperature (), the middle curve represents , and the innermost curve (closest to the axes, with the lowest pressure values) represents the lowest temperature ().
Comparing the provided graphical choices:
- Image 0: Shows the curves in reverse order (outermost at 200 K, innermost at 600 K), which is incorrect.
- Image 1: Shows a horizontal line representing constant pressure as volume changes, which violates Boyle's law.
- Image 2: Shows linear direct proportionality between pressure and volume, which is incorrect.
- Image 3: Correctly depicts hyperbolic isotherms where the curves from outer to inner are labeled 600 K, 400 K, and 200 K respectively.
Access expert-curated educational resources and study materials—completely free.
Create, conduct, and manage professional online assessments with Crey. Perfect for teachers and institutes.
Copyright © 2026 Crey. All Rights Reserved.