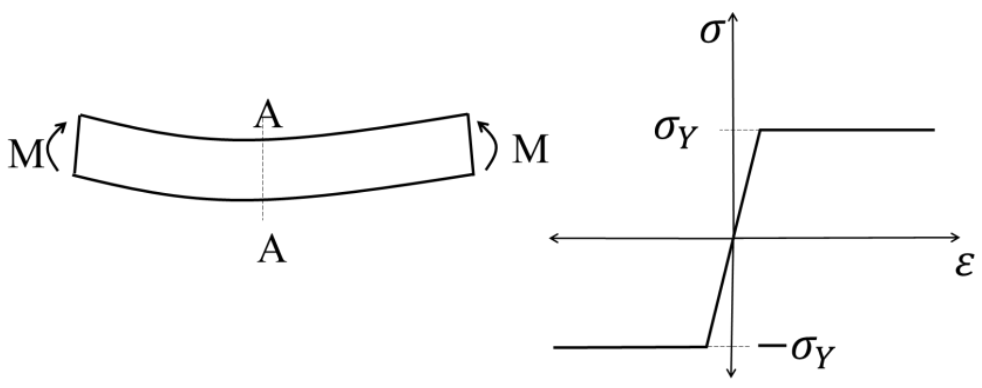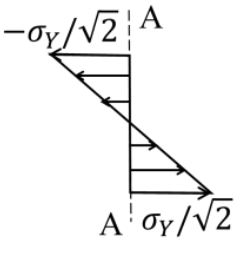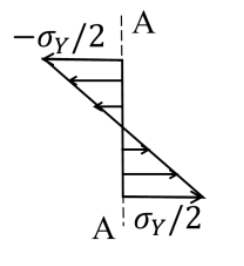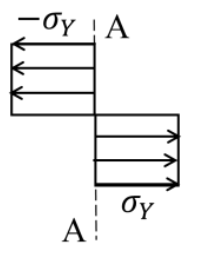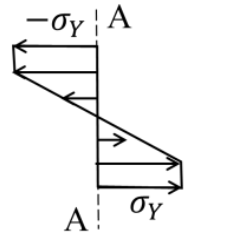
A beam is undergoing pure bending as shown in the figure. The stress (𝜎)-strain (𝜀) curve for the material is also given. The yield stress of the material is 𝜎𝑌. Which of the option(s) given represent(s) the bending stress distribution at cross-section AA after plastic yielding?
Correct Answer :
Solution :
The correct option/answer is represented by the bending stress distribution shown in the fourth image (Option 4):

Step-by-Step Explanation:
1. Strain Distribution in Pure Bending:
According to the Euler-Bernoulli beam theory, plane sections remain plane and perpendicular to the neutral axis after bending. Consequently, the longitudinal strain () varies linearly with the distance () from the neutral axis:
where is the radius of curvature of the neutral axis. This linear variation of strain is always true, regardless of whether the material is elastic or plastic.
2. Material Behavior (Stress-Strain Curve):
From the given stress-strain curve in the problem image, we see that the material behavior is elastic-perfectly plastic:
• Elastic region (): The stress varies linearly with strain according to Hooke's Law:
Since strain is linear with respect to , the stress is also linear with respect to in this region.
• Plastic region (): Once the strain exceeds the yield strain , the stress remains constant and is capped at the yield stress:
3. Bending Stress Distribution after Plastic Yielding:
When a bending moment is applied such that it causes partial plastic yielding (elastoplastic state):
• The outermost fibers experience the maximum strain. Because yielding has occurred, these fibers are in the plastic state and their stress is constant at the yield value ( for the compressed top fibers, and for the tensioned bottom fibers).
• The fibers closer to the neutral axis experience smaller strains. Near the neutral axis where the strain is less than the yield strain, the material remains elastic, and the stress increases linearly from zero at the neutral axis to at the boundaries of the elastic-plastic interface.
Conclusion:
The combined stress distribution is linear in the middle elastic zone (around the neutral axis) and flat/constant in the outer yielded zones with values of at the top and at the bottom. This corresponds precisely to the diagram in Option 4.
Access expert-curated educational resources and study materials—completely free.
Create, conduct, and manage professional online assessments with Crey. Perfect for teachers and institutes.
Copyright © 2026 Crey. All Rights Reserved.